Client Profile
Our client, with a rich background in the Salesforce ecosystem has been instrumental in developing the architecture of enterprise software products and the management of complex implementation projects for a diverse range of clients. Their customer base includes multiple Fortune 500 companies and they have spearheaded the development of Salesforce AppExchange application and AWS backend for their clients.
Challenges and Objectives
The client, seeking advanced data visualization solutions, outlined several key challenges and objectives
- Visualize data using the tabular format.
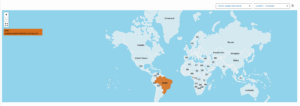
- Incorporate selectable states or countries on a map.
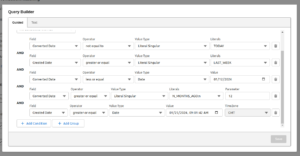
- Implement a user-friendly UI for adding query where clauses.
- Accommodate unique client requirements on an ongoing basis.
Implementation Process
The implementation of data visualization in the tabulator form and the showcasing of select states or countries on a map entailed a structured approach comprising various stages:
Requirement Gathering: The initial step involved comprehensively understanding the specific needs and preferences of the client regarding data visualization. This encompassed identifying the types of data to be displayed, determining desired interactivity levels, and elucidating any specific requirements for map visualization.

Data Preparation: Subsequently, our team engaged in gathering and meticulously preparing the data to be visualized. This entailed cleaning, structuring, and formatting the data to ensure its suitability for utilization in both the tabulator form and map visualization components.

Implementation Process
Tabulator Form Implementation: In this phase, our expert team established the tabulator library within the application framework where the data would be showcased. They meticulously defined the structure and layout of the tabulator form, including configuring columns, headers, and any desired customizations. Furthermore, the tabulator form was populated with the prepared data to facilitate seamless integration and presentation.

Map Visualization Implementation: Concurrently, they integrated the chosen Leaflet.js library into the application infrastructure. They configured the map to exhibit the desired geographic regions, such as states or countries, along with any additional features as per client specifications. Crucially, the map visualization was bound to the tabulator form to ensure synchronized representation between the selected data in the form and its
corresponding depiction on the map. Throughout the implementation process, stringent quality assurance measures were adhered to, encompassing comprehensive testing and iterative refinement. This iterative approach ensured that the final product aligned closely with the project requirements and client expectations, delivering a robust and user-friendly solution for data visualization.

Solutions Provided
To address the client’s requirements effectively, the team incorporated cutting-edge features and technologies into the project. Leveraging the latest advancements in tabulator and Leaflet maps, the solution seamlessly integrated these tools to visualize data in the desired formats. For the query Builder functionality, the team implemented the use of SLDS classes, ensuring a user-friendly interface for adding query where clauses.
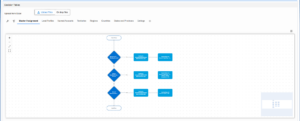
Additionally, graphical representations of policy flows were achieved through the utilization of the flow Graph library. Importantly, the team remained flexible to accommodate unique client requirements, tailoring solutions accordingly to meet their specific preferences and needs. This comprehensive approach ensured that the final product not only met the initial project specifications but also provided a scalable and customizable platform for future enhancements and adaptations.
Outcomes
Currently our client’s community site boasts a user base exceeding 43,000 individuals actively engaging with the platform. The database contains millions of records on Investments, Accounts, and Contacts. Maintenance and improvement efforts are manageable, with flexibility to customize the interface and user experience. Over 100 users are currently utilizing the Salesforce plugin, seamlessly integrating data into organizational workflows.


