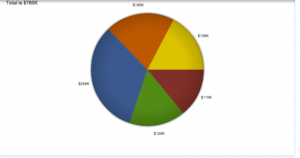
The best business decisions come from the best data insights. The more you know about your customers, the better the customer service you provide them will be. The biggest advantage of having a CRM is that you have your entire data consolidated and stored in one place. From customer profile to customer purchase history, every interaction that you have with your customers can now be documented thanks to CRM software. However, the huge heaps of data stored in your database are of little value if you cannot obtain valuable and detailed insights from it.
Reporting in CRM is a highly useful feature that helps you get a holistic view of your business performance. SugarCRM is extremely competent in comparison to other CRMs when it comes to handling large amounts of data. It lets you gather data from various modules to generate reports that give you an excellent handle on your analytics. There are four types of reports that you can create in Sugar. Let’s explore them briefly today.
1. Rows and Columns
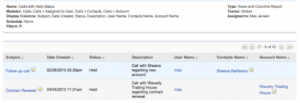
The Rows and Columns report is the most basic report to create out of the four report types. The resulting report displays the data in a simple rows and columns format, showing values for the selected fields from all records meeting the specified criteria. Users can simply define filters to determine which records the report will include or exclude and then choose the fields (e.g. Name, Email Address, etc.) they would like to display in the report result. Please note that only Rows and Columns-type reports can be exported as CSV (comma-separated values) files in Sugar. The screenshot below shows what a Rows & Columns Report looks like:
2. Summation
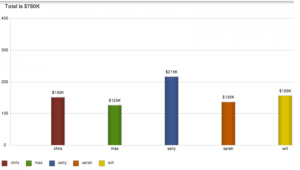
The Summation Report provides computed data based on selected fields from records meeting the specified criteria. You can group the report based on one or more fields from the target or related modules. You can choose an unlimited number of group-by columns to group the data in the report and can define group-by data for related modules as well. The report result displays the data in groups, summarized using computed derivatives (e.g. SUM, AVG, MAX, MIN) from numeric-type field values (e.g. opportunity amount, amount, etc.) as well as weighted amounts. Summation Reports can be viewed in a chart format and displayed as a Sugar Dashlet on your homepage as well.
The Summation Report does not provide detailed information, unlike the Summation Report with Details. The screenshot below shows what a Summation Report looks like:
3. Summation Report with Details
The Summation Report with Details is a combination of the Summation-type and Rows and Columns-type report as you can group the data, get the total count of records, and choose to display columns as well (e.g. Contact Name, Account Name, Email Address, etc). You can group the report based on one or more fields from the target or related modules. The Summation Report with Details can be viewed in a chart format and displayed as a Sugar Dashlet on your Home page. The screenshot below shows what a Summation Report with Details looks like:
4. Matrix
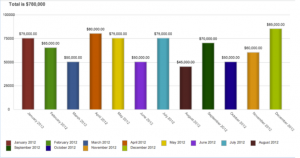
The Matrix Report is also similar to the Summation-type report as it provides an overview of the computed data and displays the total summary count. The report results are displayed in a grid table with row and column headers. The numeric field values for all display summaries appear on the table along with the total amounts for each row and column. Matrix Reports can be viewed in a chart format and can also be displayed as a Sugar Dashlet on your Home page. The screenshot below shows what a Matrix Report looks like:
Advanced Reports
This feature, available in the Sugar Enterprise and Ultimate editions, greatly enhances the reporting functionality of Sugar. Advanced reports allow you to create custom reports using SQL statements to directly query your Sugar database. Users with extensive SQL knowledge can use advanced reports to craft direct database queries for more flexible and extensive reporting.
Advanced reports are a combination of three related modules:
Custom Queries:
Custom query records contain the SQL statement used to pull information from the database.
Data Formats:
Data format records describe how to format and display the results of the related custom query. Data formats may also be interrelated to create child/parent combinations of queries.
Advanced Reports:
Advanced report records serve as headers for the report and may display one or more data formats. The advanced report record may also be scheduled to be automatically run and emailed to a user.
Custom Reports
If you feel that the reporting module in Sugar is not serving your business needs entirely, you can always get dynamic custom reports built. We have been doing this for many years now. Let’s take a look at how we extended the functionality of the reporting module in Sugar to help our clients leverage their data.
1. Inhance Technologies
Inhance Technologies specializes in transforming conventional plastics into high-performance materials. Among other requirements, the company sought to build custom reports for the senior executives. The following reports were customized:
- Activity Report for admin to run a single report on all activities in SugarCRM. Activities include emails, tasks, meetings, notes, and calls.
- Pipeline Report to view the revenue generated by each sales rep in each division of the company on a weekly, monthly or yearly basis.
- Kinamu Reports plugin was installed and customized to empower the management to do an in depth analysis of the data present in the CRM.
2. FitSales
FitSales is a Health, Wellness and Fitness company located in California. The owner wanted a completely customized Sugar Community Edition solution that would serve as an all encompassing tool to monitor and manage the complete business operations of his fitness club.Among other customization, the reports module was customized to provide a feature-rich and user-friendly web interface for managing reports within the system.
3. MyAgent
Based in New Zealand, MyAgent is a full service photography and real estate marketing company. We built Sugar solution on top of Sugar Community Edition which included custom reports to deliver managers a unified view of all key information including the set targets and performance assessment data.
4. Keystone Technologies
The company specializes in selling LED lighting products to domestic consumers and companies. It was using Sugar 7 Professional Edition and wanted to gain deeper insights about their best selling products.To simplify the complex decision making process due to large data sets and to enable the senior management get an accurate picture of which products were generating the greatest profits, custom reports were built.
Key Takeaway
CRM has diverse industry applications. Along with businesses, you can also use CRM for nonprofits to have seamless operations as CRM has a wealth of information stored inside. However, if it does not support a robust reporting module, you can’t reap the full benefits of this technology. SugarCRM comes with the Reports module to facilitate the reporting requirements of the sales, support and marketing teams. The reports provide brilliant insights into factors affecting the performance of the company. The results could be used to optimize business processes and give you complete control over your business operations.
Rolustech is a SugarCRM Certified Developer & Partner Firm. We have helped more than 600 firms with various SugarCRM integrations and customization. Get in touch today for your FREE Business Analysis. We will be happy to assist you!
